
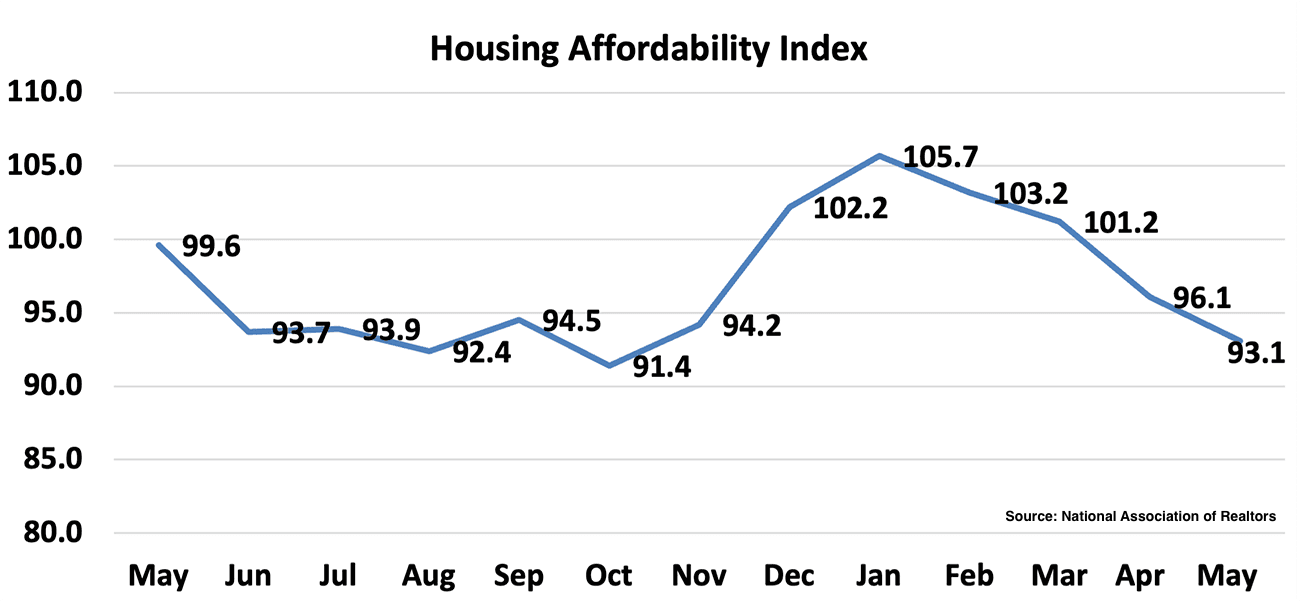
Affordability keeps sliding even as price growth cools. The National Association of Realtors’ latest index shows homebuyer affordability fell for a fifth straight month, with a buyer now needing roughly $109,000 in income to qualify for a median-priced home at today’s 6.57% mortgage rate, up from about $93,500 in January. The median existing-home price hit an all-time high of $440,600 in June, nearly 50% above pre-pandemic levels. NAR chief economist Lawrence Yun expects only modest relief as the market moves past the summer buying season, with real improvement tied to whether mortgage rates ease back toward pre-conflict levels. In the meantime, the country remains short more than 4 million homes, and economists caution that gap won’t close quickly even with the new federal housing law now in effect.
Homebuilders are feeling that math directly. For some, the share of target buyers who can qualify for a median-priced home has roughly halved since 2014-2019, pricing out much of the $60,000-$90,000 income bracket, teachers, firefighters, and other steady earners who once formed the first-time buyer base. The gap between a mortgage payment and rent has also widened in favor of renting, giving even willing buyers more reason to stay put longer.
A Split, Not A Shift
Millennial homeowner households grew 74% between 2018 and 2023, a 5.3 million-household gain, but renter households still edge out owners nationally, 12.6 million to 12.4 million. The growth is uneven by geography. Florida saw the sharpest ownership gains, while smaller, more affordable metros like Grand Rapids (68.5% ownership rate), Ogden and Provo posted the highest concentrations of Millennial owners. But rentership grew fastest in many of the same fast-growing Sun Belt and Florida markets, Orlando’s Millennial renter households rose 34%, and Cape Coral, Palm Bay and Miami each grew around 27%, suggesting strong population growth is filling both ownership and rental pipelines rather than draining one into the other. Expensive coastal metros remain renter-dominated by a wide margin: renters make up 70.1% of Millennial households in Los Angeles, 65.8% in San Jose and 64.4% in San Diego. For rent growth, that split matters, markets absorbing both new owners and new renters at volume are the ones best positioned to hold pricing power, while renter-locked coastal metros face a deeper, more entrenched demand base but less room for outsized rent growth given how stretched incomes already are there.
Household Formation, Delayed But Not Gone
Nearly half of adults under 30 (49%), now live with a parent, up sharply from pre-pandemic levels, according to Federal Reserve data. That’s reshaping what demand looks like rather than eliminating it: 19% of adults live with adult children and 15% live with parents themselves, and multi-generational households are now a meaningful, non-marginal slice of the housing market. Some states are responding by easing zoning for accessory dwelling units, giving multi-generational households an alternative to a traditional apartment. For multifamily and BTR underwriting, the effect is a lag rather than a loss, the demand doesn’t disappear, it just arrives later, which can stretch lease-up timelines and push rent growth assumptions further out for projects built around younger renter cohorts.
The political weight behind all of this is real. Housing costs rank as the top issue for voters under 35 heading into the midterms, ahead of even food costs for that group, pressure that helped push the ROAD to Housing Act into law this month.
Net effect for multifamily and BTR: the renter pool isn’t shrinking, it’s taking longer to convert into first-time buyers, and it’s being replenished by both delayed household formation and strong in-migration to affordable metros, a dynamic that should extend, not shorten, the runway for rental demand.