
The apartment market is turning a corner, slowly. That headline is evident in the Q3 2026 reports being issued by researchers. For example, Yardi Matrix’s most recent report shows the average U.S. advertised rent slipping $1 to $1,775 for the month in September, but annual growth improved to 0.7% and rents are up 1.4% year to date. The third quarter’s 0.3% gain was the first third-quarter increase since 2022. Apartment List sees the same thing from another angle. September’s 0.1% dip in median rent was far smaller than the usual seasonal drop, and annual rent growth has improved five straight months since bottoming at -1.6% in April. Vacancy has eased to 7.0% from a record 7.3% in February, though it is still above the pre-pandemic norm.
The Supply Wave Is Receding
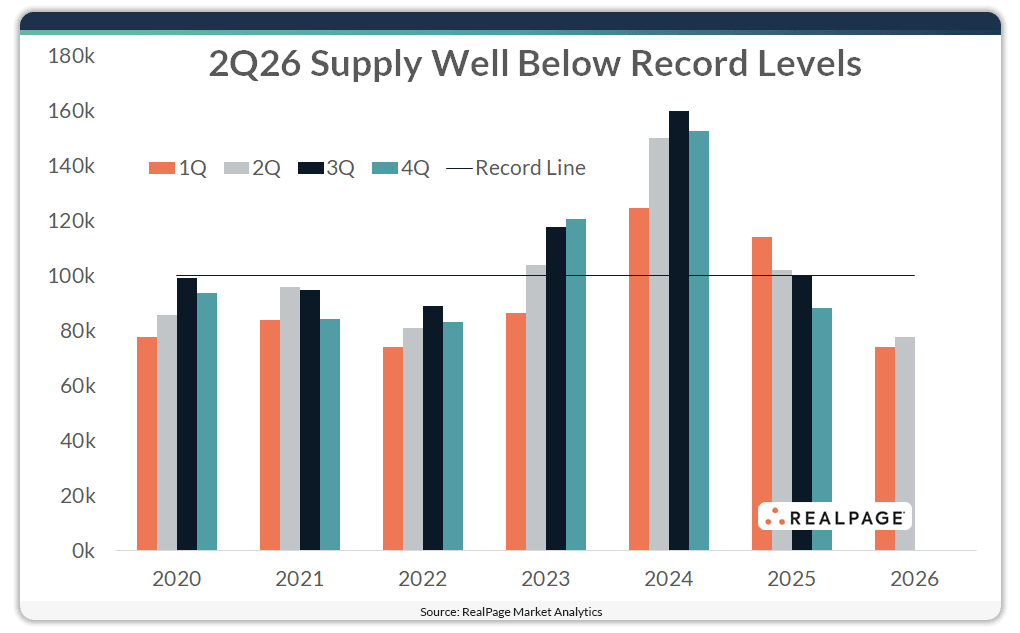
The reason is deliveries. RealPage reports that developers finished 318,000 units in the year ending in the third quarter, 46% below the late-2024 peak, and the gap between new supply and demand is the narrowest in more than a decade. The pipeline is thinning behind it. In NMHC’s latest survey, 29% of developers started fewer projects than three months ago, up from 20% in June, and 65% of that group cited economic uncertainty or projects that no longer pencil. Marcus & Millichap notes that residential permits remain more than 25% below their early 2022 peak. Fewer starts today could mean a tighter market down the road.
The improvement is also spreading. Yardi finds the gap between the second- and 30th-ranked markets has narrowed to 6.3 percentage points from 8.4 in January, and only two markets now show annual declines of 2% or more, down from five. Gateway and Midwest metros lead, including San Francisco (7.0%), New York (3.8%) and Chicago (3.2%), while the Sun Belt markets that absorbed the heaviest supply are becoming less negative. Total occupancy, which counts properties still in lease-up, reached 93.9% in August, up 50 basis points since January.
Phoenix and the Southwest
Phoenix is still working through new supply, but the data is tilting its way. Rents are down 1.1% year over year and completions equal 3.8% of existing stock, though total occupancy has climbed 0.9 points since January to 92.7%. Mark-Taylor reports that 12-month gross absorption reached 19,681 units in August, near its cycle high and up roughly 15% from 17,100 a year earlier, with seven of the past nine months absorbing more than 100% of deliveries. RealPage expects 13,000 to 13,500 more units over the next four quarters, and submarkets with little left to build look best positioned, with only 150 units scheduled for 2027 in North/Central Phoenix and 431 in Camelback and South Scottsdale. Investors have been cautious. Yardi data shows Phoenix multifamily sales fell 24.6% in the first half to $1.5 billion on fewer trades, even as the average price per unit rose 3.7%. Las Vegas is nearly flat, with rents off 0.2% and the strongest job growth (2.0%) among Yardi’s top 30 markets.
Why Renters Are Staying Put
The rent vs own conversation remains interesting. It’s worth looking back at how homeownership has changed. In 1950, about half of Americans (50%) were both married and homeowners by age 30. That share peaked near 52% in 1960 and has slid steadily since, to 25% in 2010 and just 12% in 2025. Research points to simple math. A 20% down payment once meant saving for a home that cost about 3.6 times annual income, and today it’s closer to 5.3 times. Home prices are up 408% since 1985, while wages are up 241%. Marriage and homeownership used to arrive together in a person’s twenties. Now they often come later, and renting fills the years in between.
Today’s rates stretch that gap further. The 30-year mortgage was 7.4% on Oct. 8, up from 6.3% a year ago, according to Freddie Mac. Marcus & Millichap reports that 57.6% of renters renewed in September, more than 5 points above the 2015–2019 average, and Institutional Property Advisors says the cost gap between owning and renting is more than eight times what it was a decade ago.
Aging in place tightens things further. According to Census data, about 79% of households 65 and older own their homes, compared with roughly 37% of those under 35. Boomers hold more than a third of owned homes, and over half of them have no mortgage, so selling means trading a paid-off home for a 7% loan. That keeps three-bedroom-plus homes off the market just as millennials, now 30 to 45, are in prime household-formation years. That is exactly the household BTR serves.
BTR: Choice, Not Just Necessity
BTR operators are finding that renters increasingly want to be there. Apartment manager RR Living reports that 39% of single-family renters now rent by choice, up from 23% several years ago. In its words, operators “compete with homeownership,” not just with other rentals.
The rent numbers tell a steady story, though each source measures differently. Yardi, tracking BTR communities of 50 homes or more, shows rents up 0.8% year over year with 94.9% occupancy. Cotality’s broader single-family index shows July rents up 1.8%, with detached homes (1.9%) edging attached (1.7%).
Arbor and Chandan Economics, looking at the wider SFR sector through Q2, report 2.9% rent growth, 94.3% occupancy and average cap rates of 7.2%, up just two basis points from Q1. BTR made up 6.9% of single-family starts, below its 2024 peak but still elevated by historical standards. BTR has also held up where apartment supply has weighed on rents: in Denver, BTR rents are up 1.7% versus -1.6% for multifamily, and in Austin 0.6% versus -2.5%.
The Bottom Line: apartment fundamentals are healing and the supply pipeline is thinning, even as financing stays expensive. The households priced out of ownership are not going anywhere, which adds up to steady demand for BTR and a tighter market ahead.